What are the main trading strategies?
There are loads of trading strategies that have emerged over the past decades but they always revolve around the simple idea buy low sell high.
How can BrozBot spot the best moment to open a position?
Remember that BrozBot is the first platform to offer integration with Crypto and Forex exchanges. Crypto and Forex are generally more volatile compared to the stock market. Therefore it also means there are more opportunities to gain on the price swings. But to make profit on volatile market we need to choose entry points wisely.
Currently BrozBot base its moves on a technical analysis, not on news events (regulation, hacks, cryptocurrency bans, forks, etc.). We understand that if we can combine technical analysis with trigger events our chances of a successful trade will be even higher. That’s why we are committed to implement such a feature in the near future.
Anyhow, at the moment let’s lay down the most common indicators that may help to spot an entry point with technical analysis.
To do so, let’s review an indicator of each type: Trend indicator (MACD), Momentum indicator (RSI), Volatility indicator (Bollinger Bands) and Volume indicator (OBV). Technical indicators are not limited to the ones mentioned here, but we hope it will give you a comprehensive picture on how our Bots catch a moment to open a position.
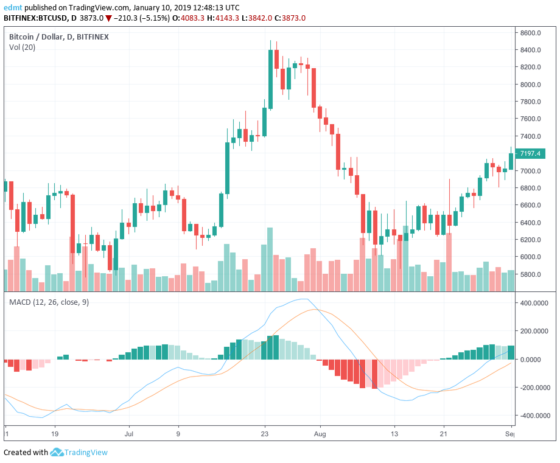
Trend indicator – MACD & CCI
Two indicators to confirm the trend are MACD and CCI. For now let’s focus on MACD – Moving Average Convergence Divergence indicator which is composed of MACD line (orange 26-period exponential moving average (EMA) subtracted from a blue 12-period EMA) and a signal line (9 day EMA). MACD is often represented as a histogram and serves to estimate how strong the trend is. When the MACD crosses the signal from above it is a signal to buy and vice versa.
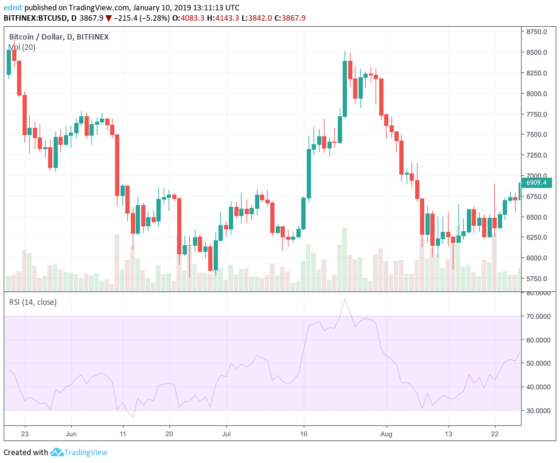
Momentum indicators – RSI & Stochastic Oscillator
Another two indicators that may come handy in spotting an entry point are Relative Strength Index (RSI) and Stochastic oscillators. RSI is calculated using Average number of periods closed up and down. The value of RSI ranges from 0 to 100 with 30 being a signal that a stock is oversold and 70 that it’s overbought. The closer the returned value is to 0 or 100, the stronger turnaround in price will be.
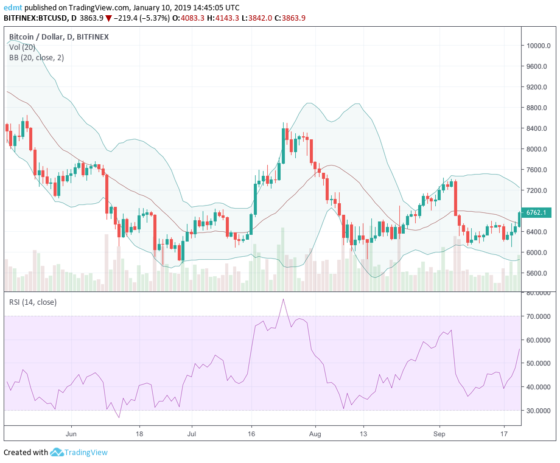
Volatility indicator – Bollinger Band
BrozBot also uses Bollinger Bands to spot an entry point combined together with other indicators. Bollinger band is a chart compounded of two lines that lie a standard deviation away (positively and negatively) from a moving average line. The price crossing the lower band is considered a buying signal and vice versa but it’s best used when combined with other indicators such as RSI.
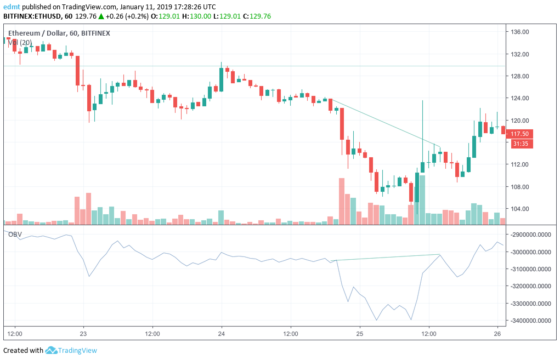
Volume indicator – OBV
On Balance Volume (OBV) is an indicator calculated as total of volume and graphically represented as a line. The indicator adds the trading volume if the previous period closed positive and subtracts the volume if the day closed negative. OBV can confirm price trends and indicate future price reversals. If the prices fall while OBV rises it can foreshadow a price increase and may vice versa. Also, OBV moving along with price serves as trend confirmation.
Conclusion
The system’s ability to follow a combination of trading strategies through API keys from exchanges makes BrozBot one of the most reliable platforms. Firstly because it cannot access or withdraw your money and secondly because our bots can work at very high-speed with the ability to place up to 100 times more orders as compared with manual traders. It is active 24/7 and eliminates the emotional quotient from trading.
The cost is also very low. Anyone can get started with a Basic Plan of $19 per month. It doesn’t matter how much capital you have on your exchange, the cost is the same for everyone. BrozBot doesn’t charge any commissions. Try it now at brozbot.com and share your results on our social media pages!