What blockchain technical analysis tells us about Bitcoin’s price range
Blockchains represent an incredibly rich and unique source of information about crypto-assets. One of the most fascinating benefits of blockchain datasets is that they contain statistically relevant patterns about the behavior of individual investors which can result highly complementary to traditional technical analysis models.
Given that we are looking at individual investor positions, the IOMAP analysis can be used to complement traditional support/resistance models by quantifying the positions of individual investors.
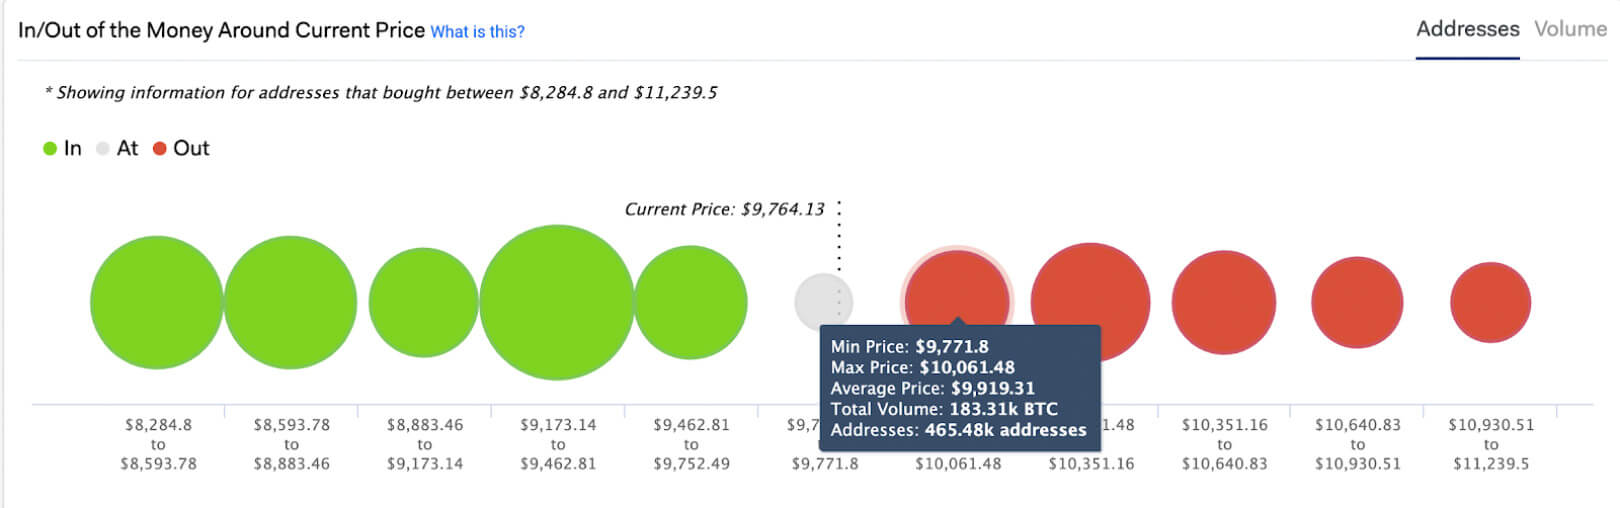
A look at the IOMAP model for Bitcoin shows just under 500,000 addresses with positions around the $9800 mark. This could be seen as a thin level of resistance for Bitcoin to get to $10,000.00 as a percentage of investors that previously bought at this price may be looking to break-even. The same analysis by volume reveals that those addresses hold over 180,000 Bitcoins, which is a sizable volume.
If Bitcoin breaks through $10,000, then it might experience similar levels of resistance to get to $10,300 and $10,600, where a larger volume of 375,000 Bitcoin was previously bought.
Another perspective that can be used to understand the current price movements of Bitcoin is analyzing investor entry and exit points with their positions. This is shown by IntoTheBlock’s In-Out Money Over Time(IOMOT) analysis. By comparing the number of addresses that were in the money at a similar price level at two points in time, we obtain an understanding of how investor positioning changed throughout that time.
For example, last time we were at a similar price range in late October, roughly 21 million addresses were making money in their positions. Fast forward to early February, almost 24 million addresses are making money at the same price range, indicating a large number of holders bought the dip. This trend indicates that bitcoin holders have been accumulating and gaining momentum as more holders are currently in the money.
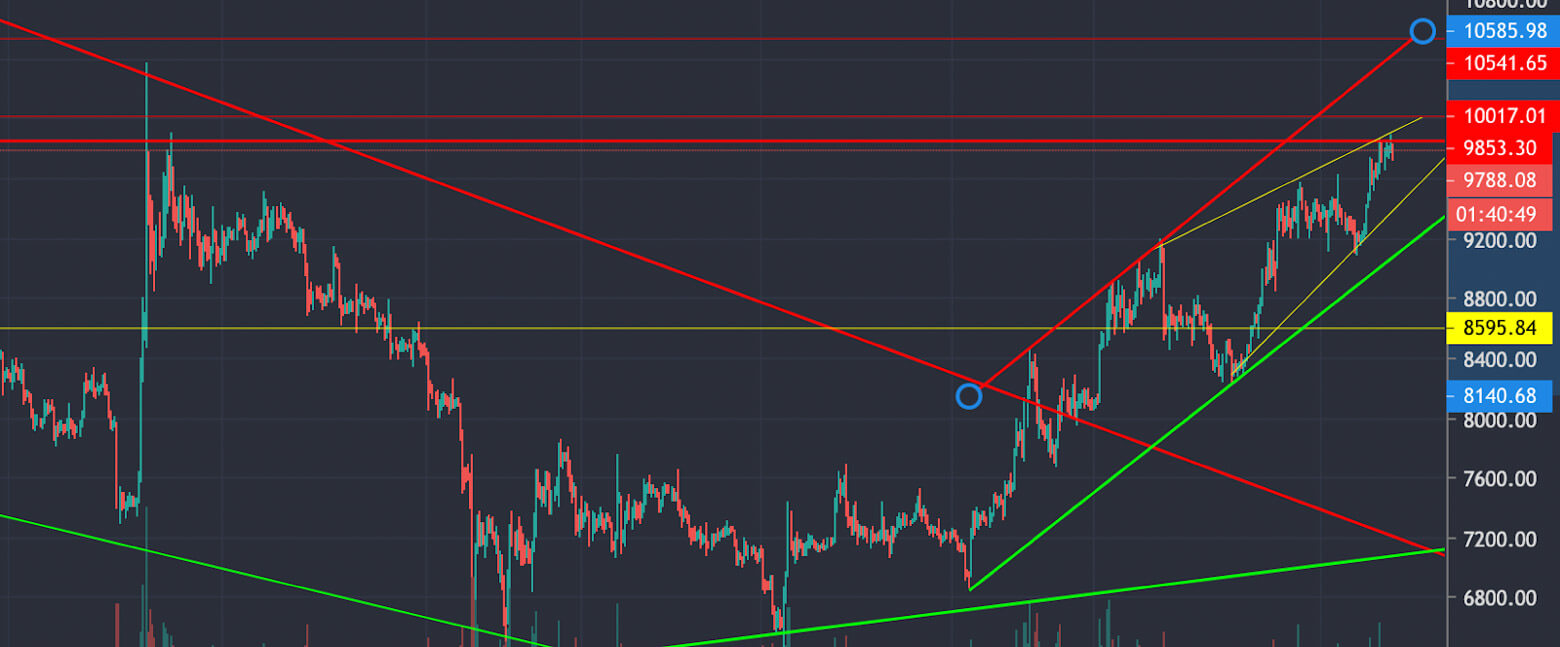
Overall, onchain analysis of Bitcoin holders’ positions demonstrates the large support and resistance levels also pointed out by technical analysts. The significant amount of holders sitting on positions bought slightly above current prices may be causing downward price pressure as some of them look to break-even around the $10,000 range.
Conversely, the even larger number of Bitcoin holders at the range between $9,200 and $9,500 is expected to create upward price pressure as people currently making money around those levels may look to buy in again. Additionally, the large increase of addresses in the money of 3 million addresses is an indicator that momentum is currently on the bullish side.